Monday, December 30, 2013

Was Comet ISON Seen in AIA 4500?

A recent blog post at The Astronomy Stackexchange asked whether an AIA image taken during the perihelion passage of Comet ISON showed the comet. It does not show the comet. The portion of the image where the bright spot is visible has a complicated pattern that is only partially removed during image processing. I will only discuss the image, not the other points made in the blog post.

The AIA 4500 image described in the blog is shown on the left. An arrow points to a bright area that is claimed to be fragments of Comet ISON breaking up near perihelion. A large format version is available from our jpeg archive on the SDO website.

This bright area is an artifact resulting from stray light entering the telescope through a pinhole leak in one of the front filters. Our science data files are available from the SDO JSOC as fits (Flexible Image Transport System) files, the astronomy way to store image data. Each CCD image moves through a series of image processing to subtract the bias field, correct for dark current, subtract the flat field, remove proton hits, and other known effects. The final science data is the processed image. You need special software to work with fits files, so we convert the images to jpeg files to make them easier for a larger audience to use.

I downloaded the fits file that leads to the AIA 4500 image at 1800 UTC, opened it in fv (a free fits viewer), and made a screenshot. Here is that original image, with an inverted color table to enhance the pattern to the left and below the image of the Sun in the upper right. This pattern is a result of a pinhole light leak in a front filter and scattering inside the telescope. While the spacecraft is moving to the offpoint, the brightness of the pattern changes, and its structure is a little smeared as well. With the solar disk out of the center of the field of view, the pattern stands out more clearly than usual; however, a similar stray light pattern is visible in all AIA 4500 images. We have decided to stop serving the AIA 4500 Å images because of this pattern (see the blog post on December 17, 2013.)

AIA 4500 images were taken once an hour during the Comet ISON perihelion passage. It was only chance that this one was taken while we were moving. The AIA 4500 image an hour later, which is much closer to perihelion and a much better exposure, is shown in the second screenshot. The pattern is now much closer to the usual pattern and the processed image at the SDO website shows no sign of the comet, but there is a little brightness in the same area as the earlier image (1289 pixels over and 1379 pixels down). This shows the difficulty in removing the pattern, especially in regions with no direct solar input.

SDO Science Team members were very disappointed to not see Comet ISON as it flew by the Sun. We are convinced that SDO data does not reveal the presence of the cometary detritus.

Monday, December 23, 2013

JSOC data flow has been restored

Images are flowing again from the SDO JSOC. Many thanks to the people who worked this weekend to repair the system.

Sunday, December 22, 2013

JSOC Disks Under Repair

Update: Images are flowing again, thanks to everyone for their patience.

The SDO HMI/AIA data distribution system is undergoing some emergency repairs, and image updates from sdo.gsfc.nasa.gov have been suspended. SDO personnel are diagnosing the problem and it is not clear how long the outage will last. Data from SDO/EVE, including SAM images, will continue to be available during the outage.
We are sorry for any inconvenience.

Friday, December 20, 2013

It's The Solstice

Tomorrow, December 21, 2013 at 1711 UTC (12:11 pm ET) is the winter solstice in the northern hemisphere (the summer solstice in the southern hemisphere). In the north we will have the shortest day and longest night, which usually means its cold. What is really means is that the Earth's rotation axis is pointing 23° away from the Sun. The north pole of the Earth is in continuous night. Many holidays are associated with the solstices and I hope you enjoy your celebration.

The Sun just keeps on producing sunspots and I would like to comment on some of the other features (prompted by a question on the SDO Twitter feed and the Rainbow of Wavelengths video.) The question was how common are dark plasmas? When we look at the Sun in EUV wavelengths it is actually quite common to see both bright and dark regions. The triptych shows AIA 193 Å, HMI magnetic field, and AIA 304 Å, all from 1800-1830 UTC today. I identified several dark regions, a coronal hole and three filaments, which will morph into prominences when they rotate onto the edge of the Sun.

Coronal holes are dark because there is very little material in that part of the corona. No material means no glow. As solar maximum starts to wind down we will probably see many more coronal holes on the Sun. The ones that form at the poles are particularly neat, as they can last for several years as little caps.

Filaments are dark for the opposite reason. There is too much material and the light from anything beyond the filament is absorbed by the filament. More or less like holding your fingers in front of your face to keep bright light out of your eyes. It is also cooler material and doesn't glow as brightly. Filaments like to form along the lines where oppositely pointed magnetic fields meet. That is easy to see in the filaments on the right (one with an arrow, the other just the letter F.) Look for the grey area between white and dark magnetic fields in the magnetogram at the same place as the filaments in the EUV images. This line is called the "Polarity Inversion Line". Can you see the Polarity Inversion Line in the filament on the left? It will probably get easier to see as it rotates towards the center of the disk.

The coronal hole has only outwardly directed magnetic field (white in the magnetogram). The field is not as strong as near the active regions and it is usually open, or goes far out into space.

The Rainbow of Wavelengths video shows how the many wavelengths of light that SDO measures allow to see the Sun in many different ways. Bright or dark, our job is to understand all of them.

Enjoy the solstice and keep watching the Sun!

Tuesday, December 17, 2013

SDO is Almost Four Years Old and Our First Problems Arise

SDO is now approaching four years old and we are seeing things that we have to figure out how to handle. Today I'll write about the AIA 4500 Å images.

The AIA 4500 Å images have been removed from the SDO web page. Several streaks have appeared in the images (you can see some on the solar disk between about 9 and 10 o'clock.) We have decided to stop serving those images and recommend that people use the HMI continuum images.

There are four channels in the 4500 Å telescope, 4500 Å, 1600 Å, 1700 Å, and 171 Å. A series of filters is rotated in front of the CCD to measure the light in each channel. About a year ago a small pinhole appeared in the front filter of the 171 Å side of the filters. This is a thin foil filter that keeps the visible light out of the EUV images. The pinhole allows visible light into the telescope. Although the 171 Å has a second filter close to the CCD to keep out the visible light, the 4500 Å cannot as it is designed to look at the visible light.

There is a selector that allows light going through either the foil filter with the pinhole or the other front window. That selector must be rotated between those windows between exposures. You see strange streaks on the 4500 Å images because the selector and other filters are being moved while the 4500 Å is being read out. The light that comes through the pinhole is enough to create a signal on the CCD.

The 4500 Å images are still available through the JSOC.

Monday, December 2, 2013

Lunar Transit, December 2, 2013

Today from 1503 – 1551 UTC (10:03-10:51 am ET) SDO watched the moon move across our view of the Sun. The next lunar transit is closer than you think, January 30, 2014, from 1331–1556 UTC (8:31-10:56 am ET). Today's lasted 48 minutes, the next will last almost 2.5 hours!

Friday, November 29, 2013

Where Was Comet ISON?

By now I am sure people are aware that something continues to move along the orbit of Comet ISON in the LASCO observations. It is being discussed whether it is debris from Comet ISON or a remnant. In either case we should try to understand why we didn't see that debris or remnant as it went through perihelion yesterday.

When SDO looks for a comet it does not see the dust and ion tails seen in a comet far from the Sun. We see oxygen ions, oxygen atoms with some electrons stripped off, glowing when they are hit by the hot electrons in the corona. The AIA telescopes normally look at iron ions, but the enormous amount of oxygen that comes off a comet allows that element to emit brighter for a while after the comet passes.

The images we showed yesterday were our best guesses for which AIA passbands would show bright emissions from Comet ISON as it flew past the Sun. They are the passbands that showed Comet Lovejoy in December 2011 and the earlier comet in June 2011. All four passbands would show emission from O IV, O V, or O VI, oxygen atoms with 3, 4, or 5 electrons removed. This is a chain, where O V is produced from O IV and then O VI is produced from O V.

We pointed SDO at three locations along the projected orbit. If you compare the predicted orbit with the SOHO images it looks like we had pretty good alignment. I was watching how the comet moved along its predicted orbit as we changed the SDO pointing and the comet moved through the frames we provided. Here is a snapshot of what I was watching, at 1844 UTC yesterday, about the predicted time of perihelion. You can see that the position of Comet ISON is in the upper left part of the square the size of the Sun showing where SDO is pointed. The AIA telescopes have a larger field of view, because they need to see the corona around the Sun. So the comet is well inside the AIA images at this time. There are some movies posted under "Processed Movies" that show the predicted position of Comet ISON along with the frames taken during the perihelion point. Check out the Comet ISON AIA 171 movies (.mov) or Comet ISON AIA 171 Perihelion (.mp4). The color table in these movies has been fixed to bring out dim features in the corona. You can watch the corona loops extending out farther into the corona then we would normally see.

To estimate the brightness of the comet we had to assume a composition of the stuff coming off the comet and the density of the corona it was moving through. Even though the comet is heated by the glow of the Sun to sublimate the material, it is the corona that strips off the electrons to create the oxygen ions. This means we have a couple of things to check as we try to understand the lack of any visible trail in the SDO images. Did Comet ISON have a strange composition? By strange it would have to have very little oxygen. Many molecules that are found in comets have oxygen atoms in them. Water, carbon dioxide, and most rocks have oxygen in them. Comet ISON appeared normal as it moved through the solar system. It may have been running out of ice as it moved into perihelion, but the dust particles should also have sublimated and contributed oxygen to the corona as they flew past.

Perhaps the corona was not as dense as we assumed. The reactions that cause oxygen ions need fast electrons. Each step in the ion chain takes a little time. If the density of the fast electrons is smaller each step takes a little longer. At the same time the oxygen ions are moving away from the orbit of the comet. As the new oxygen ions get further away from the comet their density goes down and they become more difficult to see. This will require us to go look more carefully at those places in the frames where the comet material has been the longest. Maybe a faint signal can be detected.

We have now seen two sungrazing comets in SDO data. The first disappeared before its perihelion and Comet Lovejoy broke up after perihelion and eventually dissipated. We have also looked for at least two others. One never appeared, and now Comet ISON, which appears to have snuck by perihelion without a trace. We will work to understand what happened as Comet ISON, either as a remnant or debris, flew by the Sun.

We are tied at 2-all for sungrazing comets that we saw and didn't see in AIA data. I hope another sungrazing comet comes by soon to break to tie.


Thursday, November 28, 2013

SDO has Repointed to the Sun

And the dust trail of Comet ISON has moved around the Sun.

Thanks for taking part in our SDO Data Event. A lot of people have help, especially Phil Scherrer, the HMI PI, Karel Schrijver, the AIA PI, Barbara Thompson, Leila Mays, and Kevin Addison. Many thanks to Judy Pepoy for keeping track of SDO during the off-points. The Google+ hangout had a lot of fun!

Thanks for joining us on Thanksgiving Day 2013 for Comet ISON's perihelion breakdown!

SDO is at Departure Pointing

SDO has moved to point at our Departure Pointing box. Let's keep watching!

A Pretty Dim Comet!

We are not seeing anything in 171 or 193.

Now we are hearing that the comet evaporated well before perihelion. I would think that the rocky bits would still move along the orbit and evaporate, but maybe that isn't true.

The latest SOHO LASCO C2 movies show that Comet ISON appears to have run out of steam.

SDO is Moving to the Perihelion Point Position

The Approach Pointing images will always be available for viewing.

It takes a while for the images to move through the system, about 10-15 minutes right now.

SDO is in the Approach Pointing Position

SDO has pointed toward the Approach Pointing box to look for Comet ISON. The images are moving through the data processing and should be viewable in a couple of minutes.

We are seeing images but so far no signal in 171 or 193.

Still looking here, but no comet sightings. If you look at these images long enough you can see anything!

SOHO LASCO Movies Available from our website

You can download the SOHO LASCO C2 and C3 movies of Comet ISON at http://cometison.gsfc.nasa.gov/ and selecting "Processed Movies".

Comet ISON Looking Good for Perihelion Passage, 30 minutes and we start looking!

Here is the latest image from the SOHO LASCO C3 Coronagraph. It was taken at 1254 UTC (8:54 am ET) this morning. Comet ISON is looking like a bright sungrazing comet. You can see it moving toward the occulting disk in the center that blocks the Sun from the CCD.

Comet ISON has just entered the field of view of LASCO C2. At 1300 UTC Comet ISON was 7.5 R_sun from the center of the Sun, or 6.5 R_sun from the surface. It is nearing the point where the solar heating can evaporate the small particles, converting them to molecules and atoms, and causing the dust tail to disappear.

Still looking good. Moving toward perihelion this afternoon. It is 6.5 R_sun from the the center of the Sun (5.5 R_sun above the surface.) This is only 3.8 million km (2.4 million miles) above the surface of the Sun. For those keeping track, Comet ISON moved 700,000 km (430,000 miles) closer to the Sun in a little over an hour.

Wednesday, November 27, 2013

Comet ISON Moving into Position for Perihelion

This image from the LASCO C3 Coronagraph on the SOHO satellite shows Comet ISON moving toward its encounter with the Sun. On Thursday Comet ISON will go through perihelion (the closest point of its orbit to the Sun) at about 1:45 pm ET (1845 UTC). During the next two days the comet will go very close to the Sun and make a 140° turn, almost reversing its direction and heading out into interstellar space. After several million years of heading in almost a straight line, it will change course in 2 days!

Join us for the SDO Comet ISON Perihelion Data Event tomorrow from 1 to 3:30 pm ET (1800-2030 UTC). There is also a Google+ hangout running during the perihelion passage.

Come out and watch a comet!

Tuesday, November 26, 2013

Data Flow is back to Normal

The SDO data pipeline has been repaired and data is flowing normally.

We are ready for Comet ISON's perihelion passage on Thursday. Watch for the comet at our special Comet ISON website.

Monday, November 25, 2013

JSOC is being repaired

The SDO JSOC has been upgraded and some issues are keeping data from being available. While the data is being stored safely, they are not bring served to our website. The problems are being worked and should be fixed soon.

Wednesday, November 20, 2013

SDO's Comet ISON Perihelion Event Website

SDO Comet ISON viewing page
Next Thursday, November 28, SDO will watch Comet C/2012 S1 (ISON) fly by the Sun at 1844 UT (1:44 pm ET). We have designed a website to share the SDO images with the public. Here are some tips on the SDO Comet ISON Perihelion Page.
The top bar has a couple of links and drop-down menus. You can view a movie which shows the different areas SDO will point (off-pointing- when SDO is not point directly at the sun) and explore the orbits of Comets ISON and Lovejoy (from 2011, not the current one). The 3-D interactive works with many browsers (but not Safari). It allows you to examine two sungrazing comet orbits and see the views of different satellites. Under resources are pointers to websites that discuss Comet ISON.

Three views for the perihelion of Comet ISON

The home page will have images from four of the AIA wavelengths during each the views (off points), Approach, Perihelion, and Departure. These wavelengths were chosen because in December 2011, when Comet Lovejoy passed perihelion, it was very bright in these wavelengths,  and we believe they are the best choice for Comet ISON. We will not see a normal comet tail. The glowing material is forced to move along the Sun's magnetic field. It will look like a cloud moving along and away from the orbit of the comet.
You can watch for Comet ISON using either the kiosk mode or mp4 movies. If you select "View kiosk" a new page will open and a series of images at that wavelength will be shown. As data becomes available your kiosk display will automatically add the new images. At the end of each 1-hour phase you will be looking at about 300 images. The movie will flip through all of the data and you can watch for the comet to appear. You can run/pause the display, step through the frames, and force an update. If you pause the display you can use the slider to flip back and forth in the images. New images are available in sets of 5 every minute.
If you select "Download mp4" an mp4 movie that has all of the images currently available will be sent to your machine and you can use the movie controls on your webpage to view the images. You have to re-load the mp4 every 5 minutes to get the latest data. The mp4 movies will only be updated every 5 minutes!
Join SDO and watch for Comet ISON on November 28! A great way to spend a few hours of the American Thanksgiving Day.


Tuesday, November 19, 2013

AR 11893 Waves Goodbye with an X-1 Flare

As AR 11893 rotates over the limb of the Sun it erupted with a X-1 flare at 1030 UTC (5:30 am ET) this morning. Here is a detail from the AIA 1700 Å channel. This image was taken at 5:32:55 am ET this morning. It shows a graceful arch where the flare is occurring. The AIA 1700 Å channel is sensitive mostly to ultraviolet continuum light, but during a flare some hot lines are seen. You can see details about the flare without the blooming seen in the hotter channels.

Thursday, November 14, 2013

The Perihelion Passage of Comet ISON

Comet C/2012 S1 (ISON) will be at its perihelion (the closest it gets to the Sun) on November 28, 2013. It will then move back out into the solar system, becoming a night-sky comet and then fading from view. But watch now because Comet ISON will never return! It came from the Oort cloud and it will fly out of the solar system in a few million years.

When they are close to the Sun, sungrazing comets can be seen in the EUV channels of SDO and other solar satellites as their debris lights up the Sun's magnetic field. As Comet ISON moves through perihelion, SDO will point at three places away from the Sun to track the comet. This figure describes what we will do.

About 100 minutes before perihelion we will point SDO at the “Approach” position. It takes about 5 minutes for SDO to point to a new place in space and allow the fuel to stop moving (“Move, settle”). We allow for that in the timing of the moves. SDO will then observe that part of space for one hour. The Sun will appear in the upper right corner of the images and Comet ISON will move through the images from the lower right to the upper left. Images should be available on the SDO Comet ISON website after 12:30 pm ET.

At 1:09 pm ET, SDO will be pointed to the “Perihelion” position and observe that part of space for an hour. This location includes the perihelion, which happens at about 1:44 pm ET. At 2:14 pm ET, SDO will point at the “Departure” and observe for another hour. We will see Comet ISON moving away from the Sun in this box. At 3:19 pm ET SDO will point back at the Sun and we will resume our solar studies.

You can also see this in a movie.

The Oort cloud is many, many comets orbiting very far from the Sun. Kind of the paint splatter from making the Solar System. We think it starts about 0.1 lightyears from the Sun and extends to 0.8 lightyears — about halfway to the next star. Comet ISON is the first Oort-cloud, sungrazing comet in quite a while. It has fallen thousands of AU to just barely miss the Sun and make its escape. Join us at the SDO Comet ISON website from 1700 to 2024 UTC (noon to 3:24 pm ET) on November 28, 2013 (Thanksgiving Day in the USA) to watch this unique event.

Wednesday, November 13, 2013

Sunrise from the Dark Side of a Sungrazing Comet

Can you ride a sungrazing comet around the Sun by staying on the dark side? Maybe not! When you get close enough sunlight reaches around the comet and lights up the dark side. How does that work?

This reminds me of bicycle chains and gears. How long does a chain have to be to reach around two gears? How many teeth fit into the chain as it wraps around?

Here is a picture with gears the same size and a chain wrapped around them. This is the same as gears being very far apart. The chain leaves both gears at the top and bottom of each gear. The same number of teeth are used on both gears. We can think of the Sun heating the comet in a similar way when the comet is far from the Sun. Sunlight warms only one hemisphere. But what happens if you get much closer to the Sun?
If the left gear is made much larger than the right gear we get this picture. Now the chain leaves the large gear at the arrow, far from the top and meets the small gear away from the top. More teeth are used on the large gear, but fewer on the small. This shows that light from the Sun reaches past the one hemisphere and lights up the dark side of the comet. As comet gets really close to the Sun even someone standing on the dark side will see the sunrise.

But that sunrise will not be a little Sun coming up in the East. It will look more like a total solar eclipse fading away. A bright ring will surround the edge of the comet and slowly fill your sky to the horizon as you get closer. You would be able to see the corona first, followed by the chromosphere, and finally the bright photosphere. This effect, also called the two-pulley problem, means that comets absorb sunlight over a larger area close to the Sun than they do far away. This helps them sublimate more rapidly.

Life on a sungrazing comet would sure be different!

Check out our 3-D rendering of the orbits of sungrazing Comets ISON and Lovejoy. It shows both orbits near perihelion. You can explore why different satellites see comets differently.

Wednesday, November 6, 2013

Comet ISON Off-Point Testing Today

We are testing the Comet ISON off-point sequence today. We will move to each of the three positions and wait 10 minutes, taking data to see how the detectors respond. It will take about an hour.

Here is an example of what the Sun will look like as Comet ISON goes through perihelion on November 28, 2013. Somewhere in the inky darkness the comet's light will be seen!

Update at 2:19 pm: Test is over and we are pointing at the Sun again.

Monday, November 4, 2013

November is Comet ISON Month for SDO

This lovely image of Comet ISON was taken on October 27, 2013 by astrophotographer Damian Peach. [Image credit: Damian Peach]

Now that November has arrived it's time to get ready for Comet C/2012 S1 (ISON). On November 28 (yes, Thanksgiving Day) at 1:45 pm ET, Comet ISON will fly only 730,000 miles above the surface of the Sun. Even though it is moving as fast as 375 km/s (840,000 mph), the Sun will heat Comet ISON, causing it to sublimate and leave a lot of water and grit behind. Comet ISON is about 2 km across, much bigger than Comet Lovejoy in December 2011, and it will leave a lot of itself behind.

Once the stuff sublimates we will watch for it to light up the corona in the AIA bandpasses. We saw Comet Lovejoy in 7 of the 10 bandpasses in December 2011. This time we will point SDO toward three different places where the comet is predicted to be. One will be centered about the time of perihelion for a half hour on each side of perihelion. The other two will point toward the paths the comet will use to approach and leave the Sun and take data for an hour at each place. The offpoints are much larger than the one we did for Comet Lovejoy in 2011. We expect that the comet debris will look a lot smoother for Comet ISON because the magnetic field that far from the surface is also smoother.

The near-realtime SDO images will be available as self-updating movies at a dedicated website that is being tested and will soon be ready. Until then, there is an ISON campaign website with a lot of good pictures and information about Comet ISON, written by people who study comets. You can also look at the Know Your Night Sky blog for observing hints, especially after perihelion as Comet ISON climbs away from the Sun towards the North Star.

During November we will talk about how much stuff we should see coming off Comet ISON, why the signatures of a sungrazing comet could be like how supernovae work, and how a belt going around two pulleys can help us to understand sungrazing comets.

Make November a month for Sun and comet watching!

Tuesday, October 29, 2013

Another X-class flare!

Active region 11875 let loose an X2.3 flare. Strong radio emissions were also measured during this flare. The flare started at 2142 UT (5:42 pm ET) and lasted about 20 minutes. The active region is on the limb (edge) and it rotating out of sight from SDO.

Friday, October 25, 2013

A Flaring Great Day!

So far today we have had 2 X-class flares, the latest at about 1513 UTC (11:13 am ET). Looks pretty in all the channels, so check them out on our new web server! Here's a look at the latest flare in AIA 304 Å.

Thursday, October 24, 2013

SDO Server Replacement Going Slow

We are updating the SDO web server computers to get smoother service and more storage. There are some problems with the networking software that are being worked on at this time. We should have the website reopened no later than tomorrow.

Monday, October 21, 2013

Congratulations EVE Team

Congratulations to Tom Woods and the EVE science team for flying another calibration rocket into space!

NASA successfully launched a Black Brant IX sounding rocket at 2 p.m. ET from the White Sands Missile Range, N.M., carrying instrumentation to help calibrate the EUV Variability Experiment, or EVE, aboard the Solar Dynamics Observatory, or SDO, satellite. The project scientist Tom Woods, from the University of Colorado at Boulder, confirmed that good data was received during the flight.

EVE measures the total extreme ultraviolet output of the sun, called its spectral  irradiance. As part of the SDO/EVE program, the rocket calibration flight occurs about once a year to accurately determine the long-term variations of the solar extreme ultraviolet irradiance. This kind of calibration is known as an under-flight. It uses a near-replica of the SDO/EVE instrument to gather a calibrated sounding rocket observation in coordination with the orbital satellite's observations. Comparison of the two data sets then validates the accuracy of the SDO/EVE data, providing crucial calibration of any long-term changes in the orbital instrumentation. This will be the fourth under-flight calibration for the EVE instrument. The previous flight was successfully conducted on June 23, 2012.

Friday, October 18, 2013

Southern Hemisphere Activity Picking Up

Hi Everyone- We are glad to be back!


SDO/HMI 18OCT2013 16:51:41 UT
Activity in the southern hemisphere has been picking up over the past several days with quite a few M-class flares. Here is a image of the sun today with quite a few sunspots visible on the lower half, or southern hemisphere of the Sun.


SDO/AIA 18OCT2013 17:29:24 UT


Also as you can see from the AIA image there are quite a few active regions coming into view on the limb of the Sun.  There may be some more solar activity in store over the next several days.  The activity that we have had over the past week or so has given us quite a show with some lovely Aurora.

Tuesday, October 1, 2013

SDO Mission Website Update - October 1, 2013

Due to the government shutdown, information and data presented on this website may not be up to date. For information about available government services, visit USA.gov. We apologize for any inconvenience this may cause.

Monday, September 30, 2013

SDO Flight Dynamics' Predicted Events for the Remainder of 2013

The SDO Flight Dynamics team has generated the timing of maneuvers and other events for the next 90 days. Here is a list with the year and day of year:
  • 2013/275 - HMI Roll (this Wednesday, October 2)
  • 2013/282 - EVE Cruciform (next Wednesday)
  • 2013/289 - EVE FOV & HMI\AIA Flatfield (October 16)
  • 2013/290 - Handover Season Ends (October 19, +Z active afterward)
  • 2013/303 - Comet ISON Offpoint Dress Rehearsal
  • 2013/332 - Comet ISON Perihelion (~1841z Thanksgiving Day)
  • 2013/336 - Lunar Transit (1503z - 1551z)

At this time, calibration maneuvers are considered essential activities and will happen as scheduled.
However, this blog will not be updated if NASA is closed due to a lapse in government funding.

Friday, September 13, 2013

How Can Today's Sunspot Number be 22?

When I look at the HMI continuum image today I see only a few sunspots, which are circled in the picture on the left. But if I go to the SIDC website, their official Sunspot Number is 22! How can that be?

Rudolf Wolf, one of the first observers of sunspots, noticed that different people saw different numbers of sunspots on the same day. He realized that the different counts came from using different equipment. If you look at the Sun through properly filtered low-power binoculars you might see a few large sunspots while if you looked at the same Sun with a high-power telescope you might see many more. If you look at the Sun with young eyes you might see smaller sunspots than someone with older eyes. To deal with these differences, in 1848 Rudolf Wolf developed the Wolf Sunspot Number by combining the number of individual sunspots with the number of groups of sunspots seen on the sun through a telescope with an 80 mm aperture and a magnification of 64x. He defined the Wolf Sunspot Number as RZ = k(10g + s). To generate the Wolf Sunspot Number you had to measure

  • s = the number of individual sunspots
  • g = the number of sunspot groups (either a set of counted spots or a fuzzy blob that may contain more than one sunspot)
  • k = the observer factor (explained below)
Today RZ is also called the International sunspot number, relative sunspot number, Wolf number or Zürich number.

The observer factor (k) is a number that normalizes the sunspot number observed by any person to that of Rudolf Wolf. Each observer has their own value of k, which is usually between 0.4 and 1.7. Wolf included k so that he could combine observations from observers with eyes, telescopes, and cloudiness that were not the same as his. Assigning k’s to each observer allows us to average values of RZ from several observers to get the official sunspot number. You can also use k to account for how an observer's eyes change with time.

As a rule of thumb, if you divide the Wolf number by 15, you’ll get about number of individual sunspots visible on the solar disk. (This works better at large sunspot number and does not work today.)

I see two groups on the HMI image, the group on the left is a single spot while the group on the right has maybe three. That means my estimate of the Sunspot Number is RZ = k(10 x 2 + 1 + 3) = 24 if I set k to 1. The HMI telescope has a 140 mm aperture, which is larger than Wolf's telescope, so it sees more detail or smaller spots and gives a larger Sunspot Number.

Solar maximum is usually a time of large RZ but here we are watching solar activity fade to almost a spotless Sun. Although Solar Cycle 24 has not been creating a lot of sunspots, the Sun's magnetic field (see the HMI magnetogram at left) is still doing interesting things. You can see the magnetic field of the sunspots to the left and right of the image, while the large areas of magnetic field that support prominences and coronal holes cover the disk.

That's why we study the magnetic field!

Wednesday, September 11, 2013

Stationkeeping Burn Today

Today at 2200 UTC (6 pm ET) SDO will execute a stationkeeping burn. This 2.4 second firing of four thrusters keeps SDO within its longitude limits of its assigned geosynchronous orbit. Science data will be unavailable for about an hour to allow the spacecraft to prepare for the burn, fire the thrusters, and recover from the burn.

Friday, September 6, 2013

Coronal Holes on NPR

A story yesterday on NPR's All Things Considered talked about coronal holes. I claimed that they can look like rubber chickens and kokopellis. The rubber chicken is easy to see (here on the left in a an AIA 193 image from June 1, 2012). It was nice of a filament to help form one of the legs.
The kokopelli, a flute player from the southwest Pueblo culture, requires a bit more imagination to see (on the left, another AIA 193 image from March 13, 2013).
So here is an illustration of a kokpelli to guide your eye.

There are other coronal holes in these images. The coronal hole at the south pole of the Sun got smaller going from March to June. These polar coronal holes shrink at solar maximum and then reappear at solar minimum.

Coronal holes, in all of their shapes and sizes, will become more frequent as the Sun starts to reduce solar activity back toward another solar minimum.

Like figures in clouds, these shapes are fun to find. You can look for coronal holes at the SDO data website. They show up best in the 3-color images.

You can read more about coronal holes in another blog post.

Tuesday, September 3, 2013

Fall 2013 Eclipse Season has begun

The SDO Fall 2013 Eclipse Season has begin. Every day until September 25, 2013 some part of the Earth's shadow will pass through the SDO telescopes. Here are pictures from the first eclipse of the 2013 season. On the top is a He II 304 image from 0659 on September 2 and on the bottom is a AIA 193 image from about a minute later. The Earth's shadow appears more ragged in the 193 image because of the way the gases in that atmosphere absorb the EUV light AIA is observing and the way that light is generated by the Sun. The He II plasma tends to be cooler and be held closer to the Sun's surface while the 193 emitting plasma is hot enough to extend well off the surface. You can see that difference by looking at the glow just off the edge (or limb) of the Sun near the top of the Sun.
You use the SDO data browser to flip through these images and see the interplay between the atmospheres of the Sun and Earth.

Wednesday, August 21, 2013

JSOC Computers are Replaced, Data is Flowing

The JSOC is back up and running. The replays will be run to populate the various databases. Here's an image from August 22!
Many thanks to the people at Stanford who worked to restore the data flow.

Momentum Management Thruster Firing and JSOC Update

This afternoon at 1920 UT (3:30 pm ET) SDO fired its thrusters to drive the reaction wheels to target levels. This was a planned firing.
The JSOC Data Capture Computers are being replaced as I type and will be brought online as rapidly as possible. Although the replacement was planned for the next few weeks, the outage means it being done now.

AIA Images are Unavailable

Near-realtime AIA images are currently unavailable. JSOC personnel are working on the problem and hope to have it fixed soon.

Friday, August 16, 2013

Coronal Holes

We see all sorts of things on the Sun and have named them all. Some names, such as chromosphere, make sense only if you speak an ancient language. One that is well named is a coronal hole, which is a dark area in the otherwise bright corona. As we move from solar maximum to the decline toward solar minimum, coronal holes will become a source of many of the disturbances to the geomagnetic field and the ionosphere that we call space weather. But what is a coronal hole and what does one look like?
X-ray images of the Sun often show the large dark regions that we call coronal holes. They may extend from the Sun's equator to its poles, a few from pole to pole. In the 1960's they were seen in X-ray images taken by sounding rockets and detected with some radio telescopes. They were first seen clearly in images taken by astronauts on board the Skylab space station in 1973 and 1974. Waldmeier had seen coronal holes in the 1950’s with a green line (Fe XIV 5303) coronagraph that allows the corona to be seen along the limb of the Sun but the X-ray images of the disk of the Sun really showed what they were.
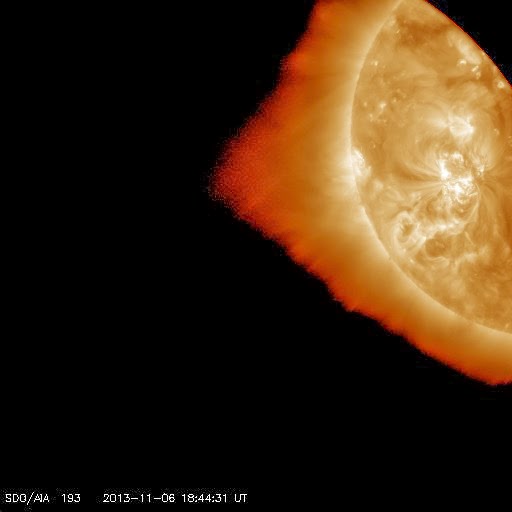
The solar corona is the outer atmosphere of the sun, extending from the solar "surface" out into space. It is difficult to observe from the ground, being seen only during solar eclipses or with special equipment. A coronal hole is a large region in the corona that has a lower density than its surroundings but with about the same temperature. It really is a hole in the corona! You can see the surface of the Sun, which is dark because it is cool next to the coronal temperatures of several million Kelvin. Although coronal holes can appear at any time of the solar cycle, they are most common and last the longest during the declining phase of the cycle.
The magnetic field in a coronal hole opens to interplanetary space. This is unlike the active Sun where the solar magnetic fields loop back to the Sun’s surface and form the bright loops and arches seen in X-ray and UV images. The rest of the Sun is covered with the quiet Sun magnetic carpet.
During solar minimum the coronal holes near the poles can last for several years. Holes near the equator may open and close in as little as a day but often remain visible for more than a month. Other magnetic features, such as sunspots and filaments, rarely last more than a rotation of the Sun (27 days). This means coronal holes may be the longest lasting magnetic feature on the Sun.
The presence of open magnetic field lines in coronal holes allows the plasma to escape, meaning that coronal holes have a lower density then the surrounding corona. The escaping particles mean that coronal holes are sources of high-speed solar wind streams. Particles in these streams can move at speeds up to 800 km/s (1.8 million mph). When the particles from these streams hit the Earth they may cause geomagnetic storms.
At times of high solar activity, geomagnetic storms are usually caused by coronal mass ejections (CME's) striking the Earth's magnetosphere. During times of low solar activity, coronal holes are the most common source of geomagnetic storms. Because coronal holes can last for many months, it is often possible to predict the occurrence of this type of geomagnetic disturbance, as the high-speed stream sweeps past the Earth with each solar rotation (like a rotating garden sprinkler). It may be possible to predict solar activity by the size of the coronal holes that form over the poles of the Sun.
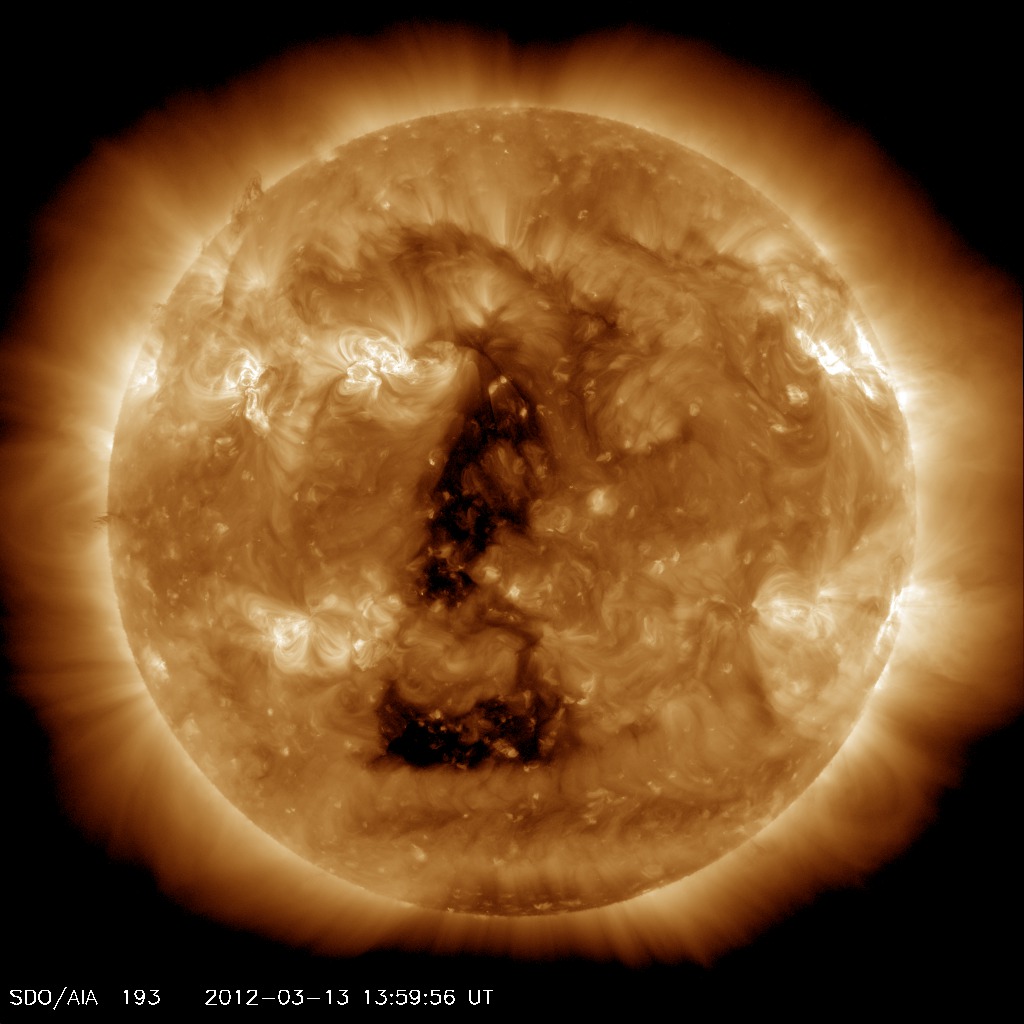
In the SDO image from August 14, 2013 shown above the bright regions indicate hotter areas of the solar corona, mainly above active regions. A large dark coronal hole extends across the northern hemisphere. The stringy dark areas are filaments, cooler plasma held above the surface of the Sun by magnetic fields.
This picture shows two sources of geomagnetic storms, coronal holes, a source of high-speed streams, and filaments, whose eruption causes coronal mass ejections, in one picture. The filament in the lower right erupted as a coronal mass ejection a few hours after this image was recorded. Aurora caused by the high-speed stream emitted by the coronal hole were seen last night.
Edit 8/19/2013: It was pointed out on Facebook that the leftmost filament is actually another coronal hole.

Wednesday, August 7, 2013

The Perihelion Passage of Comet ISON

Comet ISON is a sungrazing comet whose closest approach to the Sun (perihelion) will happen on November 28, 2013. Comet ISON was discovered last year by two Russian observers when it was further from the Sun than Jupiter. This usually means the comet is large and will become bright. Comet ISON's nucleus is thought to be about 2 miles across (no more than 4 km from HST observations). It is currently approaching the frost line at 2-3 AU where water ice will start to evaporate and the comet will brighten. We had a Comet ISON workshop last week at APL in Maryland. You can go to that site for information about Comet ISON and the many ways people will be observing it.

Comet ISON may become a spectacular comet in the night sky but SDO cannot see a comet until it is passing very close to the Sun. This graphic was developed to show what we learn from Comet ISON that is different from the previous comets that were seen by the EUV telescopes on SDO and STEREO.

The numbers on the left are the distances from the center of the Sun, with curves drawn at each integer distance from 1-4 solar radii (1-4 Rsun).

Next are the perihelion distances of the two sungrazing comets seen in the EUV and Comet ISON, also extended as curves across the diagram. Sungrazing comets do not dive into the Sun, they appear to skim along the surface of the Sun. That allows for a lot of heating from the hot Sun but also means they don't burn up from friction like a meteor in the Earth's atmosphere. Many things change as you adjust the perihelion distance. For example, Comet Lovejoy was moving at 575 km/s (1.3 million mph) at a perihelion distance of 1.15 Rsun. Comet ISON will be sailing along at a mere 375 km/s (840,000 mph) at its perihelion. Comet Lovejoy took about 1 hour to go last part of its orbit (from 2.3 Rsun to 1.15 Rsun). Comet ISON will take over 3 hours to do the same, but this time moving from 5.4 Rsun to 2.7 Rsun.

"Breaking Up" shows the locations of the Roche limits for fluid and solid spheres. If a fluid ball flies closer to the Sun then the top of this bar it will break up into fragments, if a solid ball flies closer than the bottom of the bar it will break up. The first two comets were likely to fall apart because they flew so close, well below the Roche limit for a solid ball, but Comet ISON will fly through a region where it may or may not break up.

"Ice Evaporation" is an indication of the heating by solar radiation compared to the heating at the photosphere (or 1 Rsun). The heating of the comet by the Sun increases as the comet gets closer to the surface, but another effect that I call the two-pulley problem increases the heating even more. The first is the proximity effect but the second only happens when a small body gets close to a large body. More than half of the small body gets heated at once. That means the heating rate at 4 Rsun is 30 times less than the rate at the Sun's surface rather then the 16 ([1/4]4) times less you would think from the proximity effect alone. For comparison, the heating rate at the Earth is 50000 times smaller than the heating just above the surface of the Sun!

"Melting Sand" shows the region below 4 Rsun where micrometeoroids about 1 micron in size rapidly evaporate. Micrometeoroids are small sand particles in the comet ice. As the ice evaporates the particles are released and they also evaporate as they are heated by the Sun. The location of this boundary varies a great deal with the model of the micrometeoroid and will be tested by ISON where it leaves the material behind.

The "Visibility" grey bar, is the focus of our work on ISON into what makes the comet debris bright in the EUV. It is our primary known unknown at this time.

The "Escape" bar shows the solar wind acceleration region extending from 1.1 to above 4 Rsun. Debris from Comet ISON may be swept out into the heliosphere by the same acceleration that removes the solar wind from the Sun. Observations of Comet ISON may allow us to watch this happen. A lot of debris from the earlier two comets was left in the coronal loops and will slowly become part of the solar wind.

The coronal loops and helmet streamers show the types of magnetic fields the comets will fly through. At Comet ISON the magnetic field is mostly up and down, only the helmet streamers stick up this high in the corona. Closer to the Sun the field forms coronal loops and the debris is trapped near the surface. This is why we saw the tail of Comet Lovejoy wiggling. The tail of Comet ISON will probably look like swaying stalks as it will leave debris in a much simpler magnetic field.

Have a comet for Thanksgiving!

Tuesday, August 6, 2013

August 6, 2013, Another Lunar Transit

The Moon traveled across the SDO field of view again this morning. Here's what it looked like in AIA 1600 at 1532 UTC (10:32 am ET). You can see AR 11810 peeking out from behind the Moon as the transit ends.

Monday, July 22, 2013

EVE Cruciform on July 17, Other Maneuvers this week

When you see the Sun zipping through the SDO movies you know its time for a calibration maneuver. Last Wednesday we did an EVE cruciform, nodding SDO up, down, back, and forth to allow EVE to look at how the instrument is behaving. The blurry frame on at left is an example of what happens when you take an AIA 171 image during one of the moves. This Wednesday we will do an EVE field of view and HMI/AIA flatfield. Although we can't maintain our 24/7 observing schedule during these maneuvers, they allow us to keep the instruments in excellent shape.

Sunday, July 14, 2013

Which Way is North?

Compasses tell us which way is North on the Earth. It's easy, the needle with the big N points toward the North Pole of the Earth. Other directions can be read off the dial, like a primitive GPS!
Compasses work because the Earth has a simple magnetic field with the magnetic poles in almost the same place as the rotation poles. And the compass needle points along only the part of the magnetic field that is horizontal.
The Sun also rotates and has North and South poles. But compasses aren't very useful on the Sun. The solar magnetic field is very complicated and is usually vertical rather than horizontal. Now North and South refer to magnetic fields pointing out of and into the surface.
In an HMI magnetogram (such as one from July 15, 2013 on the left) we color the outward pointing fields as white and inward as black. The weak fields are grey.
So it is probably better to think of the solar field as outward (+) and inward (-) rather than North and South. That way you won't use the magnetic field to give directions on the surface of the Sun.
On the Sun it isn’t which way is North, but which way is up!

Monday, July 8, 2013

Space Weather on Brewster Rockit

Check out the July 7 Brewster Rockit, a comic at GoComics.com. A nice little illustration about space weather effects in the heliosphere. A bit of a preview is at left.

Thursday, July 4, 2013

LMSAL JSOC Computers Shutting Down Today

Maintenance on the chillers in the building hosting the SDO JSOC computers at LMSAL means those computers have been turned off. The main JSOC archives at Stanford are unaffected and this temporary shutdown should not affect users.

Tuesday, July 2, 2013

So Long Camilla

Little SDO is looking a little sad today. His long time partner in EPO, Camilla Corona SDO has retired as the SDO mascot. Camilla had an great career as a mascot, traveling to the stratosphere and many other places to bring the excitement of science to audiences of all ages. She made young children understand that science starts when you ask questions.
Good luck in your new life as Camilla Corona the Space Chicken!

Wednesday, June 19, 2013

Where is SDO?

SDO is in a 28 degree inclined geosynchronous orbit, 36,000 km above Earth's surface. Unlike a satellite in geostationary orbit, which appears to just hover above Earth, SDO actually traces a figure-8 in the sky every day to have a direct line of sight to White Sands, New Mexico, where the two dedicated ground stations are located.

You can always check in and see where SDO currently is here: http://sdo.gsfc.nasa.gov/mission/moc.php

How long did it take to plan and design SDO?

It took a little over 10 years to plan and design SDO. More information the multi-phase process below.
Pre-Phase A- 1997 - After the launch of the Solar & Heliospheric Observatory (SOHO) in 1995, solar scientists began thinking about what data they were still lacking that was necessary to do the science that they wanted to do. From this needs assessment and based on lessons-learned from the SOHO build, launch and data they began to develop the preliminary ideas for the next Heliophysics strategic mission. For the SDO, Lockheed Martin, Solar and Astrophysics Laboratory was selected to build and operate the Atmospheric Imaging Assembly (AIA), and to build the Helioseismic and Magnetic Imager (HMI). HMI would be operated and the huge data stream (~4 TB per day) managed at Stanford University, while the University of Colorado, Boulder would build and operate the Extreme Ultraviolet Variability Experiment (EVE).

Phase A- 2002- The deliverable at the end of Phase A is System Concept Study report which contains, more specific instrument requirements, a more complete budget. 

Phase B- 2003- During Phase B, the preliminary plan is converted into a baseline technical solution - requirements are further defined, schedules are determined, and specifications are prepared to initiate system design and development. The deliverable at the end of the phase is the Preliminary Design review document, which sets out very specific requirements for the build and testing of the instruments down to how many threads a bolt will have, and the exact pressure that will be used to attach said bolt.

Phase C and D- Build, Integration and Testing- 2004
Phase C represents the beginning of the implementation stage. The Phase C deliverable is the Critical Design Review
 There is a lot of activity in Phase C including:
·      Procurement of all aspects of the space craft
o   Announcements of opportunity go out in 2005 for technical aspects of the space craft.  These announcements unlike the instrument announcements contain of the design and technical specifications required.
o   Manpower profile peak- All manners of engineers are modeling, building and testing every aspect of the spacecraft for various factors, operations, ability to withstand space, integration with other spacecraft instruments and bus.
o   HMI, EVE and AIA are built onsite at the subcontract locations
·      The Testing of all of the parts of the spacecraft in the thermal vacuum chambers and on the vibration tables to ensure that they are space ready.
Phase D Deliverable is the pre-ship review, and the completed and launched spacecraft.
·      At this point there is a comprehensive audit in which all of the procurements are matched up with budget items and check lists
Launch an initial commissioning takes place during phase D.


Phase E- Science mission and Operations- 2010
During Phase E science data is collected and made available to the public for scientific investigations that take place around the world. The mission is monitored 24 hours a day 7 days a week by the mission operations team at Goddard Space Flight Center. The instruments are monitored and operated at their respective institutions. To date SDO has met minimum mission success, meaning it has fulfilled all of the mission goals. It has taken over 100 million images of the sun and served 4500 terabytes of data.

What is space weather and what research is SDO doing with space weather?

Space weather is (1) the study of eruptive solar activity (solar storms) such as solar flares, coronal mass ejections, solar energetic particles, (2) the effect these storms have on Earth, the rest of the solar system (for example the other planets) and (3) the effect on our technology in space and on Earth.

SDO has provided incredibly detailed observations of the sun and the areas that produce space weather activity. This includes observing the growth of sunspot regions (main flare and major CME producers) as well as the birth of CMEs and the evolution of solar prominences, which often produce large CMEs.  Link to larger version of the picture http://sdo.gsfc.nasa.gov/gallery/main/item/150

How long will it take SDO to complete its mission?

Although it is difficult to determine exactly when the SDO mission will end, we know it will be around for at least another decade.  Once the mission has ended, we will use SDO’s thrusters to move it several hundred miles higher in altitude into a collision-free zone; this is important because we don’t want it to collide with any active satellites and cause them damage.  Once SDO is moved out of its orbit we will turn it off...but luckily that is not going to happen for several more years!  (Fun fact: SDO has enough fuel to keep it in orbit for several hundred years!)
Where is SDO now? Check out its current operations information .

What has been the most surprising discovery SDO has made thus far?

That is a tough one. Here is one surprising discovery for each of the instruments.

AIA: AIA observed a comet travel through the sun’s corona, travel behind the sun and emerge around the other side intact.
 http://www.youtube.com/watch?v=fFC2IU-O8M0

HMI: HMI has the first clear detection of emerging sunspots below the solar surface (visible layer called the photosphere) before there is any indication on the surface. http://www.youtube.com/watch?v=C9GZN6UvYNI

EVE: EVE scientists discovered extra energy in solar flares up to 5 hours after the peak of a flare. http://www.youtube.com/watch?v=9w3SakwPXQc